- Author Nora Macey macey@family-relation.com.
- Public 2023-12-16 10:17.
- Last modified 2025-01-23 08:47.
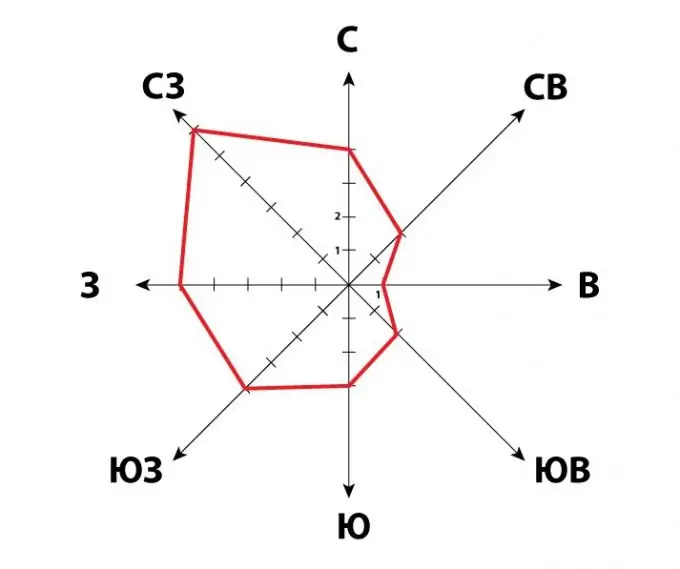
The wind rose is a vector diagram, a visual drawing that characterizes the wind regime in a certain area for a certain period. It is she who helps in planning the construction of houses and the development of cities, and often determines the well-being of certain urban areas. A wind rose can be drawn up in a month or in a few days.

It is necessary
A pencil, a piece of paper in a box, a table of wind direction data from any weather site
Instructions
Step 1
It is worth starting to compose a wind rose from the coordinate axes. In this case, however, there are not 2, as usual, but 8: in all cardinal directions and their combinations. From the center of coordinates, you need to postpone the axes in all directions horizontally, vertically and diagonally at an angle of 45 degrees. Label the axes as S (south), N (north), W (west), E (east), and SE (southeast), SW (southwest), NW (northwest), and NE (north- East). Now you can proceed directly to the construction of the rose.
Step 2
Write down a series of wind observations for a certain period in a certain area, for example, for 20 days in Moscow. This data is easy to get from any meteorological site. The results should look like: 1st day of observation - NW direction, 2nd - NW, 3rd - N, etc. until the last day of measurements. The easiest way is to write out the data in the form of a two-line table.
Step 3
Group the results by wind direction. So, for example, it turns out that in 20 days the north-west (NW) wind in Moscow was 7 days, west (W) - 4 days, etc. You should get 8 digits in terms of the number of directions, among which there may be 0, if there was no wind in this direction for the selected period. The sum of all digits must be equal to the number of days of measurements. Check - if this is not the case, you have miscalculated somewhere.
Step 4
Now start building. To do this, select and mark a unit line on each axis. Now, along each axis, you need to postpone the calculated number of days of wind in a given direction, for example - along the SW - 3 units, along South - 5 units. etc. After all the points on the 8 axes are plotted, simply connect them with segments until you get a closed polygonal path. The resulting irregular "flower" with sharp rays will look like a rose - this will be the wind rose for a given area for the selected period. It should be noted that for each region there are wind roses typical for months and seasons, which largely characterize the climate of a given area.


